November 2, 2023
雅思小作文系列 | 栏目推送说明

分享雅思考试小作文真题范文。每一篇范文都经由专业团队反复校对,最终外教审查定稿。成功就是日复一日那一点点小小努力的积累。
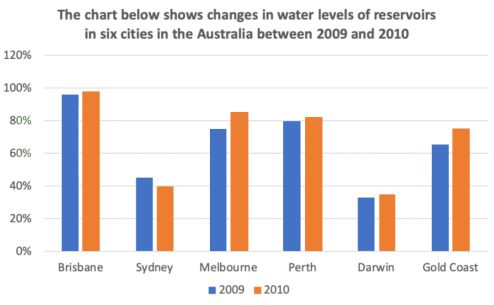
[2023/ 10/28] The chart below shows the water levels in reservations in six cities in Australia in October 2009 and October 2010.
【主体段分段】:按照时间分段
【开头段】
The bar chart compares six Australian cities in terms of water levels of reservoirs in October 2009 and October 2010 .
【概述段】
Overall, Brisbane had the highest water level of reservoir among all the cities in both years.Also, except the water level in Sydney, the figures in all the other five cities showed a rising trend.
思路要点:
- Brisbane的水库水位两年都最高
- 除了Sydney,其他城市的水位都上升
【Body 1】
In 2009, the water level in Brisbaneranked the topamong these cities(98%),followed bythe figure in Perth(80%) and that in Melbourne(78%).By contrast, the water level in Darwinwas the lowest(36%), which was roughlyhalf ofthe figure in Gold Coast.
思路要点:2009年
- Brisbane水位排第一,Perth和Melbourne分别排名第二、第三
- Darwin水位最低,大约是Gold Coast的一半
【Body 2】
In the subsequent year,there emerged a marginal growth by2% in the water levels of reservoirs in Brisbane, Perth and Darwin. The water levels in Melbourne and Gold Coastalsoexperienced an upward trend, with the figures rising considerably by 5%.By contrast, Sydney was the only city where the water level of reservoirdropped significantlyfrom 44% in 2009 to 40% in 2010.
思路要点:2010年
- Brisbane, Perth and Darwin的水位小幅度上升
- Melbourne和Gold Coast 的水位显著上升
-只有Sydney的水位显著下降